Smoothing of Two-Phase Volume-of-Fluid (VOF) Simulations

Smoothing is required in two-phase Volume-of-Fluid (VOF) simulations at high Reynolds numbers to prevent tearing of the free surface due to a discontinuity in the tangential velocity between the air and the water across the free surface. The free-surface boundary layer is not resolved in VOF simulations at high Reynolds numbers with large density jumps such as air and water. Under these circumstances, the tangential velocity is discontinuous across the free-surface interface and the normal component is continuous. As a result of the discontinuity, unphysical tearing of the free surface tends to occur.

As discussed by Fu, Ratcliffe, O’Shea, Brucker, Graham, and Wyatt (2010) and Dommermuth, Fu, O’Shea, Brucker, and Wyatt (2010), Favre-like filtering can be used to alleviate this problem by forcing the air velocity at the interface to be driven by the water velocity in a physical manner. These papers are available at http://tinyurl.com/ybh4rw4w and http://tinyurl.com/yaedzwqe. The filtering is similar to using smoothing in High-Order Spectral (HOS) simulations (see Dommermuth and Yue, 1987). This type of filtering is called density-weighted velocity smoothing (DWVS) by Dommermuth.

Sussman (2003) and Sussman, Smith, Hussiani, Ohta, and Zhi-Wei (2007) use extrapolation to push the water velocity into the air.   With extrapolation, there is the possibility of overshooting the velocity. Also, the tests that Sussman (2003) and Sussman, et al. (2007) perform do not consider the formation of thin jets, which is a more demanding test.  However, the method is promising and deserves further investigation.

Fu, et al. (2010) discuss the use of jets formed by certain types of standing waves to test DWVS. The test is based on the studies of Longuet-Higgins and Dommermuth (2001).   As Fu, et al. (2001) show, the test is easily set up in two-phase simulations of standing waves.

The test is illustrated using four different cases. An animation of the results is available at the top of this blog entry. The upper left quadrant is a 128^3 simulation with DWVS, the lower left quadrant is a 256^3 with DWVS, the upper right quadrant is a 128^3 simulation without smoothing, and the lower right quadrant is a 256^3 simulation without smoothing.   The simulations without smoothing breakup over time, especially the high-resolution simulation, whereas the simulations with DWVS converge.

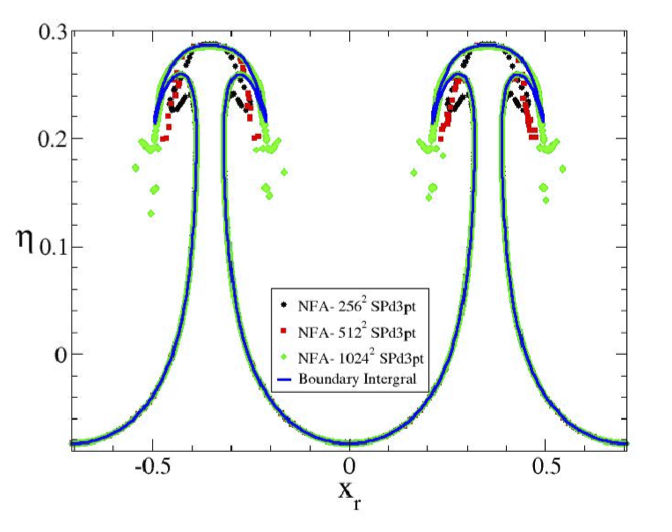
The figure below is from Fu, et al. (2001).   The figure shows three different resolutions with DWVS to a boundary-integral method.   For the highest-resolution DWVS simulation there is very good agreement with the boundary-integral method with a physical breakup at the tips of the free-surface jets where vortices are shed into the air.    Details of the comparison are provided in Fu, et al. (2001).

The viscosity in DNS simulations at low Reynolds number inhibits the tearing of the free surface.   Examples of DNS simulations at low Reynolds numbers include Deike, Popinet, and Melville (2015), Deike, Melville, and Popinet (2016), and Deike, Pizzo, and Melville (2017), but these approaches cannot be extended to wavelengths greater than 10 to 20cm because of limitations associated with resolving the free-surface boundary layer and severe Courant restrictions. Often DNS simulations like Deike, Melville, and Popinet (2016) use an artificially low Reynolds number to stabilize their simulations. Even with an artificially high viscosity, the tearing that is observed in some DNS simulations is probably due to poor resolution of the free-surface boundary layer and the subsequent jump in the tangential velocities.

As Dommermuth, D.G., Lewis, C.D., Tran, V.H., and Valenciano, M.A. (2014) show, simulations at high Reynolds numbers are desirable to study (1) the formation of windrows, Langmuir circulations, and wind streaks; (2) wave growth due to the effects of the wind boundary layer in the air and the drift layer in the water; (3) meandering of the cross wind and cross drift; and (4) spilling breaking waves. Dommermuth, et al. (2014) is available at http://tinyurl.com/y79sm9rp. Videos associated with Dommermuth, et al. (2014) are available at http://tinyurl.com/y8madvbw.

References:

Brucker, K. A., O’Shea, T. T., Dommermuth, D. G., and Adams, P. (2010) “Three-dimensional simulations of deep-water breaking waves,” Proceedings of the 28th Symposium on Naval Hydrodynamics, Pasadena, California, USA.

Dommermuth, D. G. and Yue, D. K. (1987) A high-order spectral method for the study of nonlinear gravity waves, J. Fluid Mech., vol. 187, 267–288.

Dommermuth, D. G., Fu, T. C., O’Shea, T. T., Brucker, K. A., and Wyatt, D. C., (2010) Numerical prediction of a seaway, Proceedings of the 28th Symposium on Naval Hydrodynamics, Pasadena, California, USA.

Dommermuth, D.G., Lewis, C.D., Tran, V.H., and Valenciano, M.A. (2014) “Simulations of wind-driven breaking ocean waves with data assimilation,” Proceedings of the 30th Symposium on Naval Hydrodynamics, Hobart, Tasmania, Australia.

Deike, L., S. Popinet, and W. Melville (2015), Capillary effects on wave breaking, J. Fluid Mech., 769, 541–569.

Deike, L., W. Melville, and S. Popinet (2016), Air entrainment and bubble statistics in breaking waves, J. Fluid Mech., 801, 91–129.

Deike, L., Pizzo, N. E., and Melville, W. K. (2017) Lagrangian transport by breaking surface waves. J. Fluid Mech. (submitted).

Fu, T.C., Ratcliffe, T., O’Shea, T.T., Brucker, K.A., Graham, R.S., Wyatt, D.C., and Dommermuth, D.G. (2010) A comparison of experimental measurements and computational predictions of a deep-v planing hull, Proceedings of the 28th Symposium on Naval Hydrodynamics, Pasadena, California, USA, 2010.

Longuet-Higgins, M. and Dommermuth, D. (2001) Vertical jets from standing waves, Proc. R. Soc. Lond., Vol. A 457, 2137–2149.

Sussman, M. (2003) A second-order coupled levelset and volume of fluid method for computing growth and collapse of vapor bubbles, 
J. of Comput. Phys., 187, 110–136.

Sussman, M., Smith, K.M., Hussaini, M.Y., Ohta, M., and Zhi-Wei, R. (2007) A sharp interface method for incompressible two-phase flows. J. Comput. Phys., 221, 469-505.

Initialization of Two-Phase Volume-of-Fluid (VOF) Simulations

Numerical simulations of nonlinear progressive waves are prone to developing spurious high-frequency standing waves unless the flow field is given sufficient time to adjust (Dommermuth, 2000). An adjustment scheme allows the natural development of nonlinear self-wave (locked modes) and inter-wave (free modes) interactions.

For High-Order Spectral (HOS) simulations, an adjustment procedure allows nonlinear free-surface simulations to be initialized with linear solutions. For two-phase volume-of-fluid simulations like the Numerical Flow Analysis (NFA) code, nonlinear waves are generated from rest by gradually applying a surface stress. NFA requires a different approach than HOS because the necessary two-phase solutions for progressive waves are not readily available. Dommermuth, Fu, O’Shea, Brucker, and Wyatt (2010) show that the adjustment procedure can be used to initialize fully-nonlinear simulations of regular waves and irregular seas. The paper is available at http://tinyurl.com/yaedzwqe.

The figure below shows an adjusted NFA solution in comparison to an exact Stokes wave up to the sixth harmonic.   Note that there are no oscillations in the Fourier harmonics.

Deike, Popinet, and Melville (2015), Deike, Melville, and Popinet (2016), and Deike, Pizzo, and Melville (2017) use third-order Stokes solutions to initialize their two-phase VOF simulations.   As discussed by Dommermuth (2000) and Dommermuth, et al. (2010), third-order Stokes solutions lead to the formation of spurious high-frequency standing waves for simulations of both regular waves and irregular seas and are inappropriate for fully-nonlinear simulations of waves.   The gradual application of a surface stress (see Dommermuth, et al., 2010) eliminates problems with initializing two-phase VOF simulations with third-order solutions.

References:

Dommermuth, D. G. (2000) The initialization of nonlinear waves using an adjustment scheme, Wave Motion, 32, 307–317.

Dommermuth, D. G., Fu, T. C., O’Shea, T. T., Brucker, K. A., and Wyatt, D. C., (2010) Numerical prediction of a seaway, Proceedings of the 28th Symposium on Naval Hydrodynamics, Pasadena, California, USA.

Deike, L., S. Popinet, and W. Melville (2015), Capillary effects on wave breaking, J. Fluid Mech., 769, 541–569.

Deike, L., W. Melville, and S. Popinet (2016), Air entrainment and bubble statistics in breaking waves, J. Fluid Mech., 801, 91–129.

Deike, L., Pizzo, N. E., and Melville, W. K. (2017) Lagrangian transport by breaking surface waves. J. Fluid Mech. (submitted).

Fissioning of a Wave Packet

The figure below shows fissioning of a wave packet using the High-Order Spectral (HOS) method and the Numerical Flow Analysis (NFA) code with comparisons to experiments. The experiments are reported in Su (1982). Details of the HOS simulation are available in Dommermuth and Yue (1987). Details of the NFA simulation are available in Dommermuth, Fu, Brucker, O’Shea, and Wyatt (2010).  The paper is available at http://tinyurl.com/yaedzwqe.

Su (1982) studied experimentally the evolution of wave groups that had initially square envelopes. For wave steepnesses ranging from 0.09 to 0.28, he measured the free-surface elevation at eight stations down the tank. For wave steepnesses greater than 0.14, he observed intense two-dimensional breaking at distances between ten and twenty carrier wavelengths from the wavemaker. Fifteen to twenty-five wavelengths from the wavemaker, crescent-shaped breaking waves often developed, and from twenty to forty-five wavelengths away, two-dimensional spilling breaking was common. The initial packet has 5 waves.

NFA is a two-phase formulation with volume-of-fluid code interface tracking.   NFA solves the full three- dimensional Navier-Stokes equations using an implicit sub-grid scale (SGS) model. NFA allows wave overturning and wave breaking. The results here show that NFA can accurately model subtle wave nonlinearities.

For the NFA simulation, a wave packet is generated using a surface stress. A fixed frame of reference is used. Unlike the HOS simulations, the NFA simulations allow breaking. For these NFA simulations, the breaking manifests itself as coaming at the crests of the waves at the front of the wave group. At about forty wavelengths from the wavemaker, we confirm the experimental observation that the wave group fissions into two packets. The NFA simulations are able to predict a weak wave nonlinearity that occurs over one hundred wave periods. The agreement between results of the numerical simulations and experimental measurements suggests that VOF simulations could be used to study the long-time evolution of a seaway complete with wave breaking.

References:

Dommermuth, D. G. and Yue, D. K. (1987) A high-order spectral method for the study of nonlinear gravity waves, J. Fluid Mech., vol. 187, 267–288.

Dommermuth, D. G., Fu, T. C., O’Shea, T. T., Brucker, K. A., and Wyatt, D. C. (2010) Numerical prediction of a seaway, Proceedings of the 28th Symposium on Naval Hydrodynamics, Pasadena, California, USA

Su, M. (1982) Evolution of groups of gravity waves with moderate to high steepness, Phys. Fluids, vol. 25, 2167–2174.


Windrows forming on Sheepscot Lake

Here is a video of windrows forming on Sheepscot Lake. The white streaks of foam are the windrows. The formation of windrows is described in Dommermuth, D.G., Lewis, C.D., Tran, V.H., and Valenciano, M.A. (2014) “Simulations of wind-driven breaking ocean waves with data assimilation,” Proceedings of the 30th Symposium on Naval Hydrodynamics, Hobart, Tasmania, Australia. The paper is available at http://tinyurl.com/y79sm9rp. Videos associated with the paper are available at http://tinyurl.com/y8madvbw. Animations of windrows forming are available at these links: https://youtu.be/6r9JbrykUcE, https://youtu.be/JnLGxS3c4dA, https://youtu.be/IhrHRJSYfPE, and https://youtu.be/Sbn23QN3jD4.

The effects of surfing on the formation of windrows

This animation shows a numerical simulation of windrows forming.  Among other things, Dommermuth, Lewis, Tran, and Valenciano (2014) discuss the formation of windrows under the action of wind. The paper is available at http://tinyurl.com/y79sm9rp. Videos associated with the paper are available at http://tinyurl.com/y8madvbw. Dommermuth, et al. (2014) use Lagrangian particles to illustrate the formation of windrows. Animations of windrows forming using Lagrangian particles are available at these links: https://youtu.be/6r9JbrykUcE, https://youtu.be/JnLGxS3c4dA, https://youtu.be/IhrHRJSYfPE, and https://youtu.be/Sbn23QN3jD4. A video of windrows forming on a lake is available at https://youtu.be/iL0wb00Y4es.

As discussed by Dommermuth, et al. (2014), surfing and swirling jets are key mechanisms in the formation of windrows. Pizzo (2017) and Deike, Pizzo, and Melville, W. K. (2017) also study surfing using Lagrangian particles.

Dommermuth, et al.’s (2014) studies are three-dimensional. Pizzo’s (2017) studies are two-dimensional. As shown by Dommermuth, et al. (2014), the formation of windrows is strongly tied to the formation of Langmuir circulations in the upper ocean and wind streaks in the lower atmosphere. Pizzo discusses implications of surfing in the upper ocean, but since his simulations are two-dimensional, some key mechanisms associated with the formation of windrows and Langmuir circulations are missing. Furthermore, most of the surfing events that are observed in Dommermuth, et al. (2014) are due to spilling breaking, whereas Pizzo’s (2017) analysis is focused on plunging.

Dommermuth, et al. (2014) study the formation of windrows as a result of surfing wind-driven waves. Pizzo (2017) studies Lagrangian transport using analytical solutions for plunging breaking waves, and Deike, et al. (2017) use dispersive focusing to model Lagrangian transport. Pizzo (2017) and Deike, et al. (2017) need to get off the computer and out of the laboratory and visit Sheepscot Lake on a windy day (see https://youtu.be/iL0wb00Y4es) to see how foam surfs waves.

Pizzo (2017) does not cite Dommermuth, et al. (2014). Whether or not Deike, et al. (2017) cite Dommermuth, et al. (2014) is unknown.

References:

Dommermuth, D.G., Lewis, C.D., Tran, V.H., and Valenciano, M.A. (2014) “Simulations of wind-driven breaking ocean waves with data assimilation,” Proceedings of the 30th Symposium on Naval Hydrodynamics, Hobart, Tasmania, Australia.

Pizzo, N.E. (2017) Surfing surface gravity waves, J. Fluid Mech., 823, 316–328.

Deike, L., Pizzo, N. E. and Melville, W. K. (2017) Lagrangian transport by breaking surface waves. J. Fluid Mech. (submitted).


Analysis of Plunging Breaking Waves

Energy dissipation, air entrainment, and statistical analyses of plunging breaking waves based on the Numerical Flow Analysis (NFA) code are discussed in Brucker, O’Shea, Dommermuth, and Adams (2010) “Three-dimensional simulations of deep-water breaking waves,” Proceedings of the 28th Symposium on Naval Hydrodynamics, Pasadena, California, USA. The paper is available at http://tinyurl.com/y8eava8e. Videos associated with the paper are available at http://tinyurl.com/yc38hk5u.

Volumetric energy and air entrainment analyses are made by Chen, Kharif, Zaleski, and Li (1999), Brucker, et al. (2010), Deike, Popinet, and Melville (2015), and Deike, Melville, and Popinet (2016). Brucker, et al. (2010) and Deike, et al. (2016) analyze the spatial variation in air entrainment. Brucker, et al. (2010) analyze the spatial variation in the mean kinetic energy balance using Reynolds and Favre averaging.

Brucker, et al. (2010) use an adjustment procedure to slowly ramp up plunging breaking events. Deike, et al. (2015) and (2016) use third-order theory. The adjustment procedure of Brucker, et al. (2010) is more robust than third-order theory for initiating two-phase codes.

References:

Brucker, K. A., O’Shea, T. T., Dommermuth, D. G., and Adams, P. (2010) “Three-dimensional simulations of deep-water breaking waves,” Proceedings of the 28th Symposium on Naval Hydrodynamics, Pasadena, California, USA.

Chen, G., Kharif, C., Zaleski, S., and Li, J. (1999) Two-dimensional Navier-Stokes simulation of breaking waves, Phys. Fluids, 11, 121-133.

Deike, L., Popinet, S., and Melville, W. (2015), Capillary effects on wave breaking, J. Fluid Mech., 769, 541–569.

Deike, L., Melville, W., and Popinet, S. (2016), Air entrainment and bubble statistics in breaking waves, J. Fluid Mech., 801, 91–129.

Wind-Driven Breaking Ocean Waves

Dommermuth, Lewis, Tran, and Valenciano (2014) discuss wind-driven breaking waves. The paper is available at http://tinyurl.com/y79sm9rp. Videos associated with the paper are available at http://tinyurl.com/y8madvbw.

A formulation is developed to assimilate ocean-wave data into the Numerical Flow Analysis (NFA) code. NFA is a Cartesian-based implicit Large-Eddy Simulation (LES) code with Volume of Fluid (VOF) interface capturing. The sequential assimilation of data into NFA permits detailed analysis of ocean-wave physics with higher bandwidths than is possible using either other formulations, such as High-Order Spectral (HOS) methods, or field measurements. A framework is provided for assimilating the wavy and vortical portions of the flow. Nudging is used to assimilate wave data at low wavenumbers, and the wave data at high wavenumbers form naturally through nonlinear interactions, wave breaking, and wind forcing. Similarly, the vertical profiles of the mean vortical flow in the wind and the wind drift are nudged, and the turbulent fluctuations are allowed to form naturally. As a demonstration, the results of a HOS of a JONSWAP wave spectrum are assimilated to study short-crested seas in equilibrium with the wind. Log profiles are assimilated for the mean wind and the mean wind drift. The results of the data assimilations are (1) Windrows form under the action of breaking waves and the formation of swirling jets; (2) The crosswind and cross drift meander; (3) Swirling jets are organized into Langmuir cells in the upper oceanic boundary layer; (4) Swirling jets are organized into wind streaks in the lower atmospheric boundary layer; (5) The length and time scales of the Langmuir cells and the wind streaks increase away from the free surface; (6) Wave growth is very dynamic especially for breaking waves; (7) The effects of the turbulent fluctuations in the upper ocean on wave growth need to be considered together with the turbulent fluctuations in the lower atmosphere; and (8) Extreme events are most likely when waves are not in equilibrium.

Three-Dimensional Plunging Breaking Waves

The above animation is described in the paper “Three-Dimensional Simulations of Deep-Water Breaking Waves.” The paper is available for download at http://tinyurl.com/y8eava8e. Videos associated with the paper are available at http://tinyurl.com/yc38hk5u.

The formulation of a canonical deep-water breaking wave problem is introduced, and the results of a set of three-dimensional numerical simulations for deep-water breaking waves are presented. In this paper fully non- linear progressive waves are generated by applying a normal stress to the free surface. Precise control of the forcing allows for a systematic study of four types of deep-water breaking waves, characterized herein as weak plunging, plunging, strong plunging, and very strong plunging.

The three-dimensional isocontours of vorticity exhibit intense streamwise vorticity shortly after the initial ovular cavity of air is entrained during the primary plunging event. An array of high resolution images are presented as a means to visually compare and contrast the major events in the breaking cycles of each case. The volume-integrated energy shows 50% or more of the peak energy is dissipated in strong and very strong plunging events. The volume of air entrained beneath the free surface is quantified. For breaking events characterized by plunging, strong plunging and very strong plunging, significant quantities of air remain beneath the free surface long after the initial breaking event. The rate at which the air beneath the free surface degasses is linear and the same in all cases. The use of volume-weighted (Reynolds) and mass-weighted (Favre) averages are compared, and it is found that statistics obtained by Favre averaging show better agreement with respect to the position of free surface than do those obtained by Reynolds averaging. The average volume fraction plotted on a log scale is used to visually elucidate small volumes of air entrained below the free surface. For the strong plunging and very strong plunging cases significant air is also entrained after the initial plunging event at the toe of spilling breaking region. Improvements to the Numerical Flow Analysis code, which expand the types of problems it can accurately simulate are discussed, along with the results of a feasibility study which shows that simulations with 5-10 billion unknowns are now tractable.